

Executive Summary
In the United States, K-12 school finance is largely controlled by the states. The inner workings of individual states’ systems are complex, often driven by a grid-work of funding rules and formulas that have evolved over decades of political wrangling, legislation and litigation. In many states, only a small group of people possess full knowledge of how billions of public dollars make their annual migration from states to districts to schools and classrooms.
Yet the stated goal of each of these systems is to provide all students, regardless of their backgrounds or circumstances, with the opportunity to achieve common (and hopefully desirable) educational outcomes.
A handful of states do this reasonably well. But most do not.
In this report, we evaluate the K-12 school finance systems of all 50 states and the District of Columbia. We assess each system (and the U.S. overall) using a small set of measures focused on how much states leverage their capacity to fund schools (fiscal effort), how that money is distributed (progressivity) and, most importantly, whether it is enough to meet common outcome goals (adequacy).
These three measures are calculated using state-of-the-art methods and data from over a dozen different sources. They are designed to provide a succinct but nuanced and informative overview of each state’s system that is accessible to all stakeholders. The latest year of data presented in this report is 2019 (the 2018-19 school year), but we also examine trends in our measures going back as far as the mid-1990s.
Our results on effort, adequacy, and progressivity are presented for each state individually, but they can be summarized by 10 key findings (presented below) about the overall state of K-12 school finance systems in the U.S.
How We Evaluate States' Systems
Most analyses and discussions of school funding focus on how much states (or districts) spend. This is obviously important information, but by itself it is a rather blunt tool for evaluating K-12 finance systems. The more appropriate question is whether that funding is enough. Some districts require more resources than others to achieve a given level of outcomes, due to differences in students served (e.g., poverty), labor costs, and other factors. Simply comparing how much states or districts spend ignores this enormous variation in how much they must spend to meet their students’ needs.
Accordingly, we use a national cost model to calculate adequate funding levels for the vast majority of the nation’s public school districts. We then use these estimates to evaluate each state based on the overall adequacy of funding across all its districts (statewide adequacy) as well as the degree to which high-poverty districts are more or less adequately funded than affluent districts (equal opportunity). Finally, because states vary quite drastically in their ability to raise revenue, we also assess whether states are leveraging their capacity to fund schools by measuring total state and local spending as a percentage of states’ economies (fiscal effort).
These three “core indicators”—effort, statewide adequacy, and equal opportunity—offer a parsimonious overview of whether states’ systems are accomplishing their primary goal of providing adequate and equitable funding for all students, regardless of their backgrounds.
Selected national findings
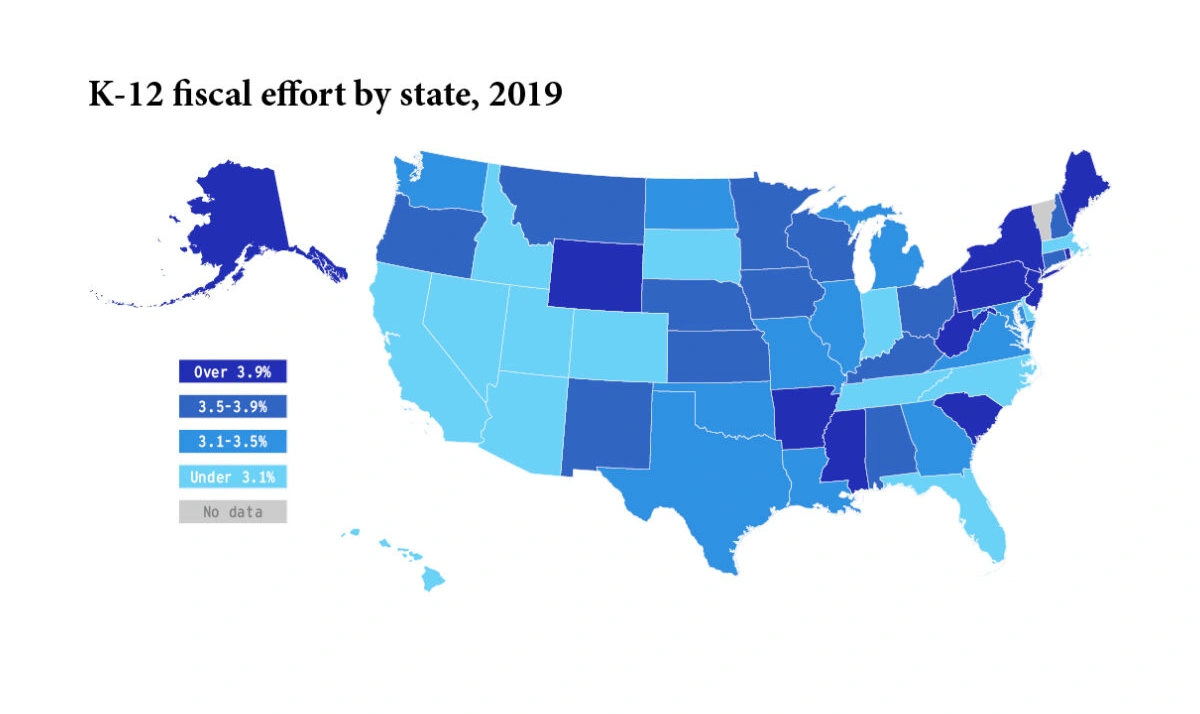
The proportions of states' economies devoted to schools vary widely.
Effort ranges from roughly 2.5 percent of gross state product in Hawaii and Arizona to 4.5 percent in New Jersey.
In other words, at New Jersey’s effort level, funding in Hawaii and Arizona would increase 80 percent.
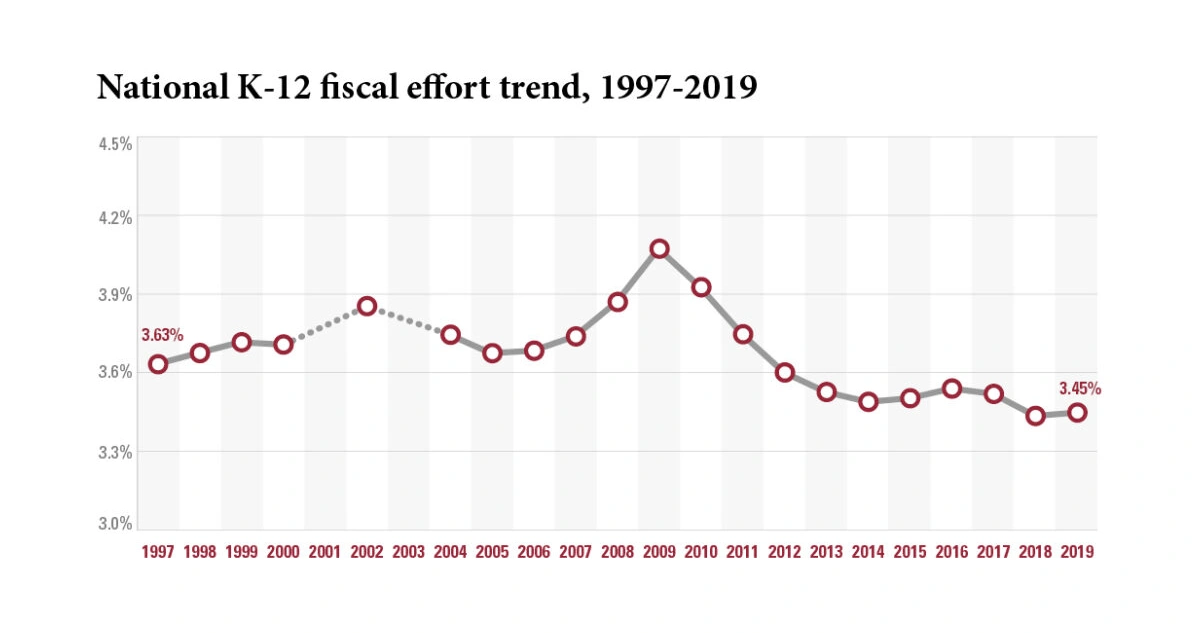
U.S. average effort is at its lowest level in at least 20 years.
In 37 states, effort is lower than it was, on average, during the four years before the 2007-09 recession.
Even after their economies recovered, most states failed to reinvest in their schools.
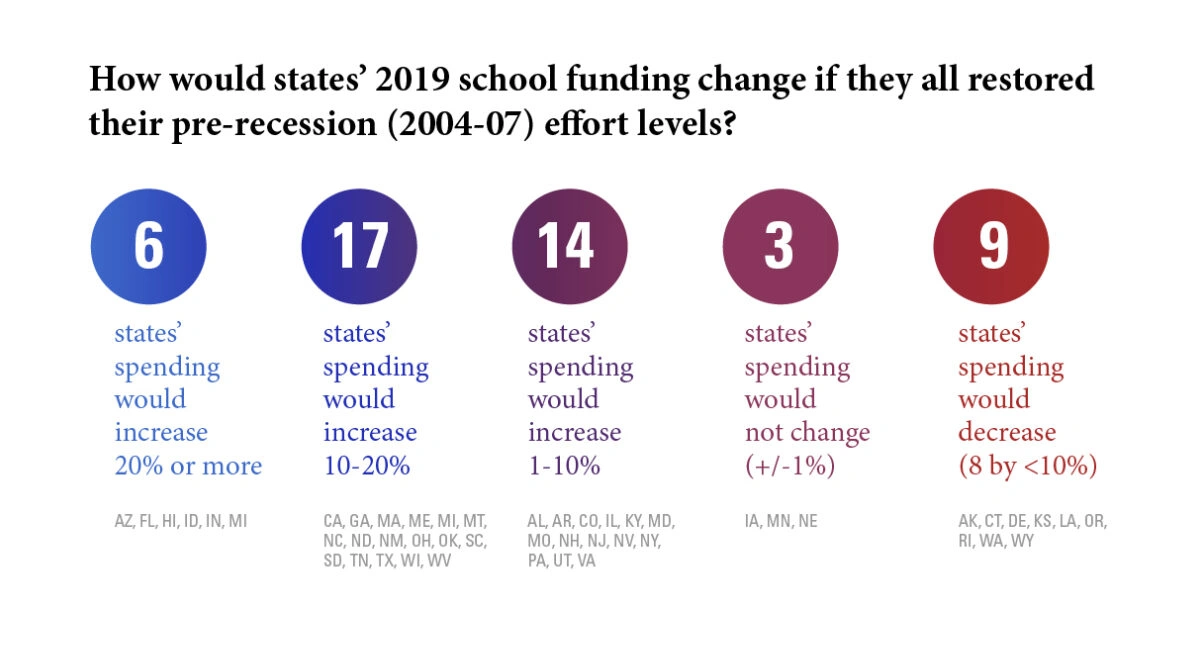
Decreasing effort since 2007 "cost" U.S. schools almost $70 billion in 2019 alone.
As an illustration, if all states had restored their average 2004-07 effort levels by 2019, total spending would be $67 billion (roughly 10 percent) higher.
The total cumulative “loss” between 2013 and 2019 is $420 billion, 9 percent of total spending over this time period.
Interstate inequality of education funding is increasing.
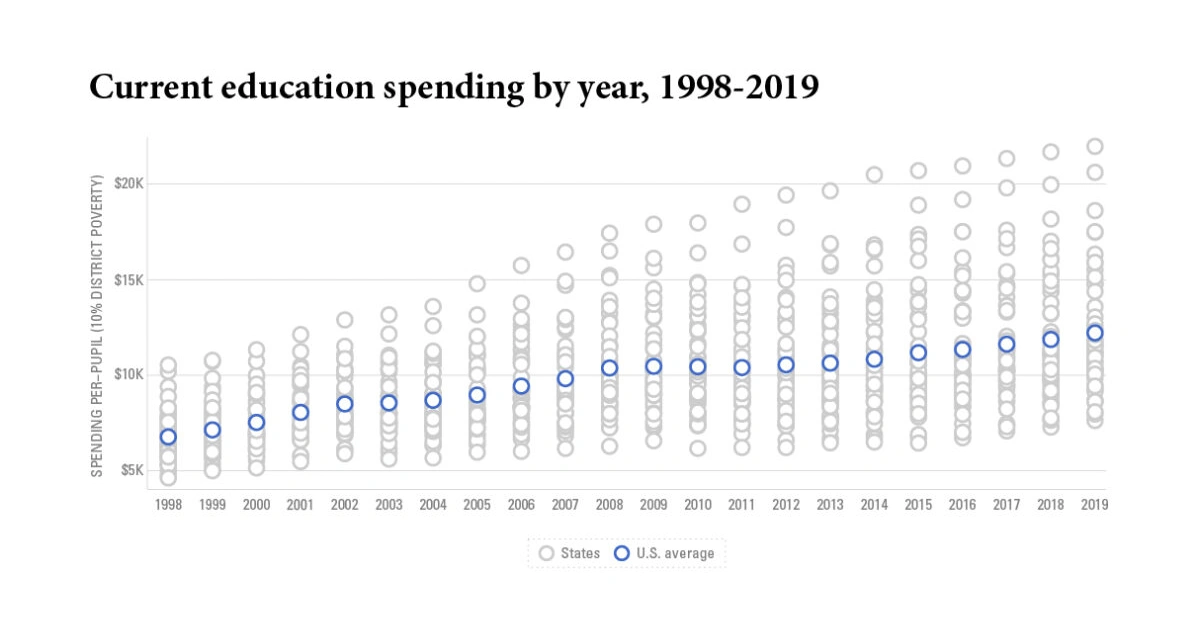
The gap between the 10 highest- and lowest-spending states increased roughly 250 percent between 1998 and 2019.
Much of this increase occurred after the 2007-09 recession, largely because some states restored funding but most did not.
Educational opportunity in the U.S. is highly unequal.
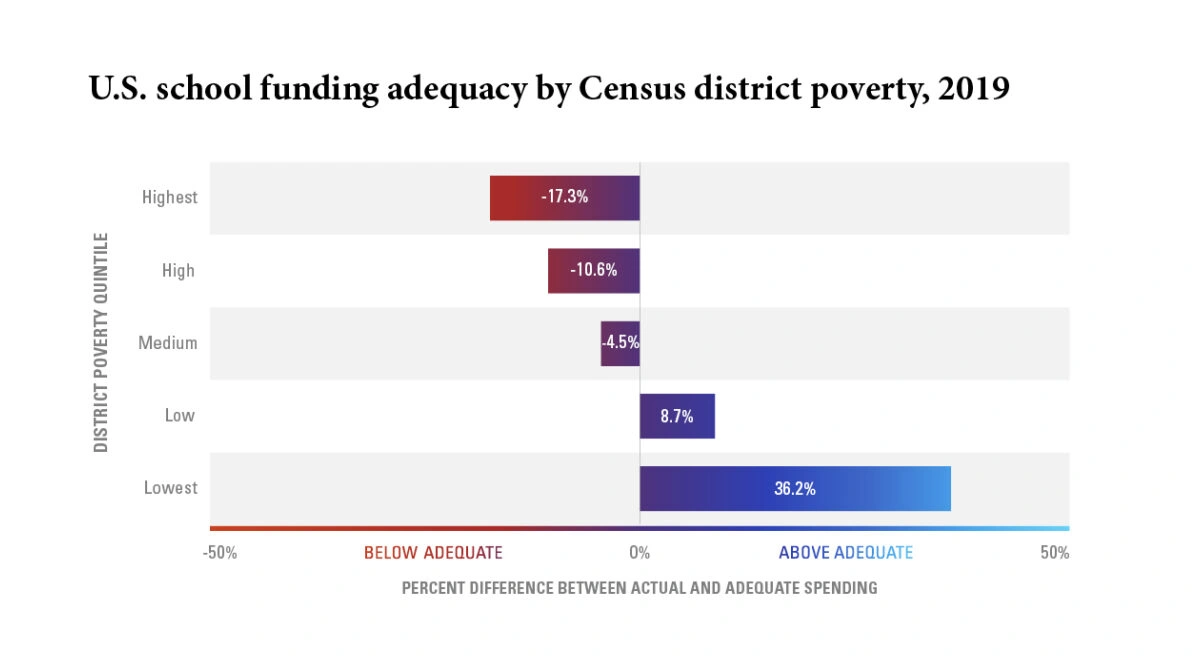
In states’ highest-poverty districts, on average, actual spending is 17 percent below estimated adequate levels. In 18 states, this negative funding gap is more than 30 percent under adequate levels
Only 8 states spend below our adequacy targets in their lowest-poverty (wealthiest) districts, and the average gap in the U.S. is +36 percent.
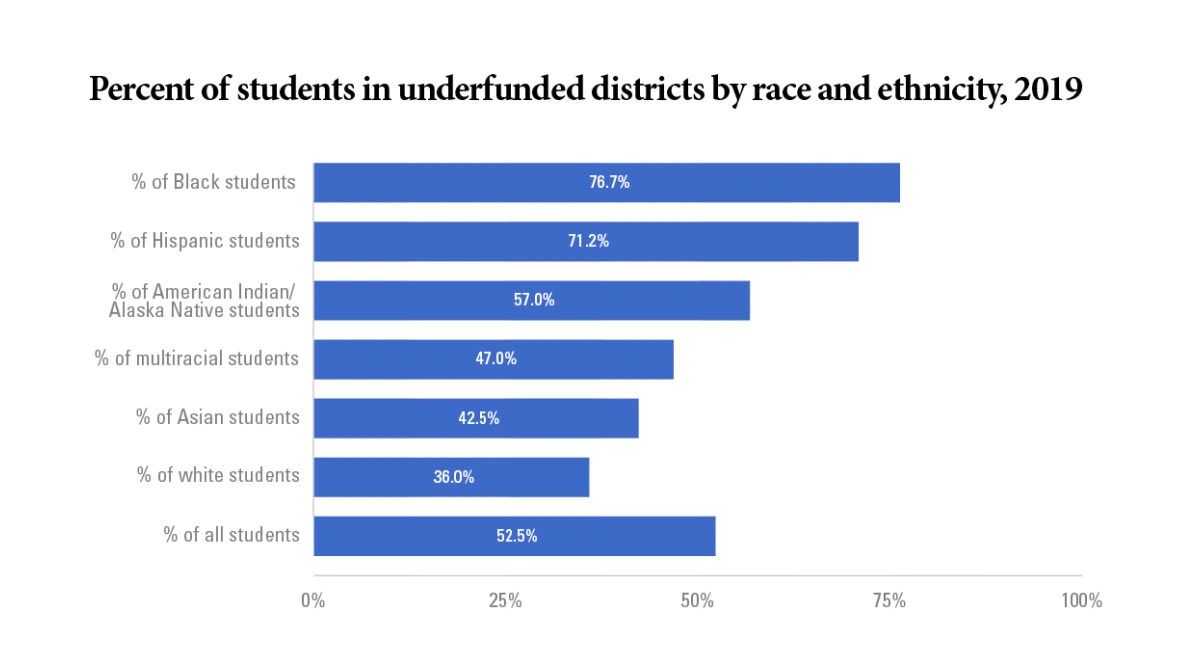
There are stark discrepancies in funding adequacy by student race and ethnicity.
Black/African-American and Hispanic/Latinx students are twice as likely as white students to attend underfunded schools.
Spending is 21 percent below adequate in the typical Black/African-American student’s district, and 13 percent below for the typical Hispanic/Latinx student. In contrast, the average white student’s district spends 21 percent above adequate levels.
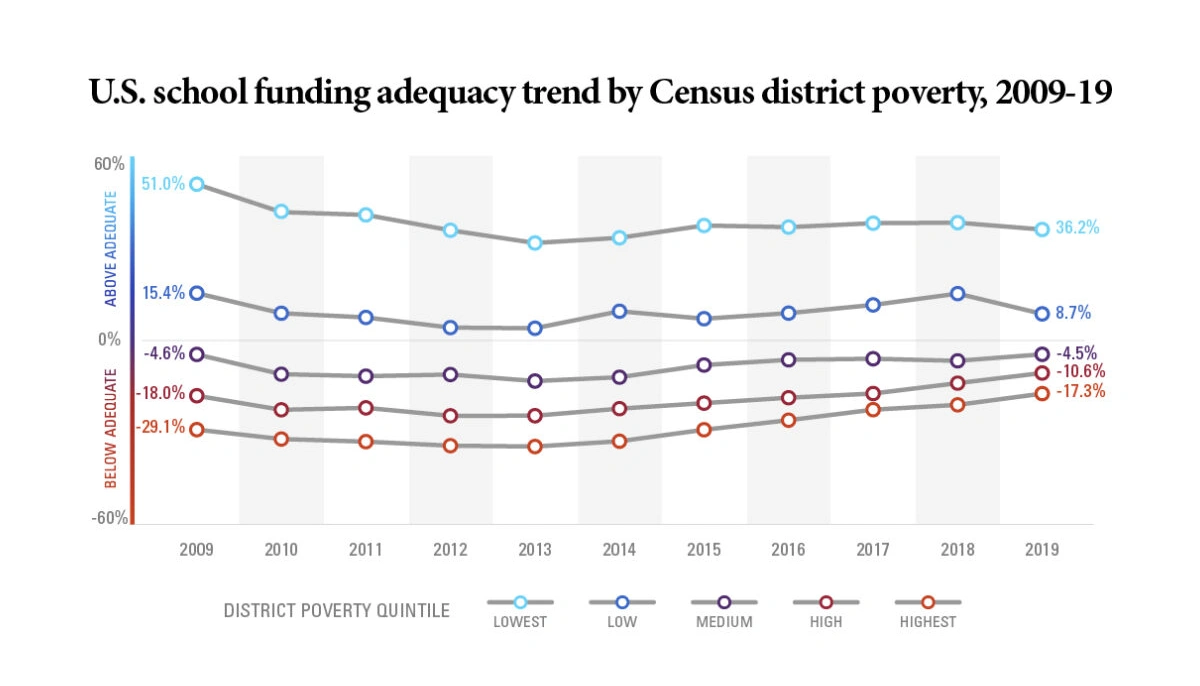
On average, K-12 funding has become moderately less inequitable since 2009.
The average negative funding gap in states’ highest-poverty districts improved about 12 percentage points between 2009-19, while the positive gap declined about 15 points for the wealthiest districts.
Our adequacy measures begin in 2009, and so we cannot say whether this trend represents recovery from the recession or a longer-term improvement.
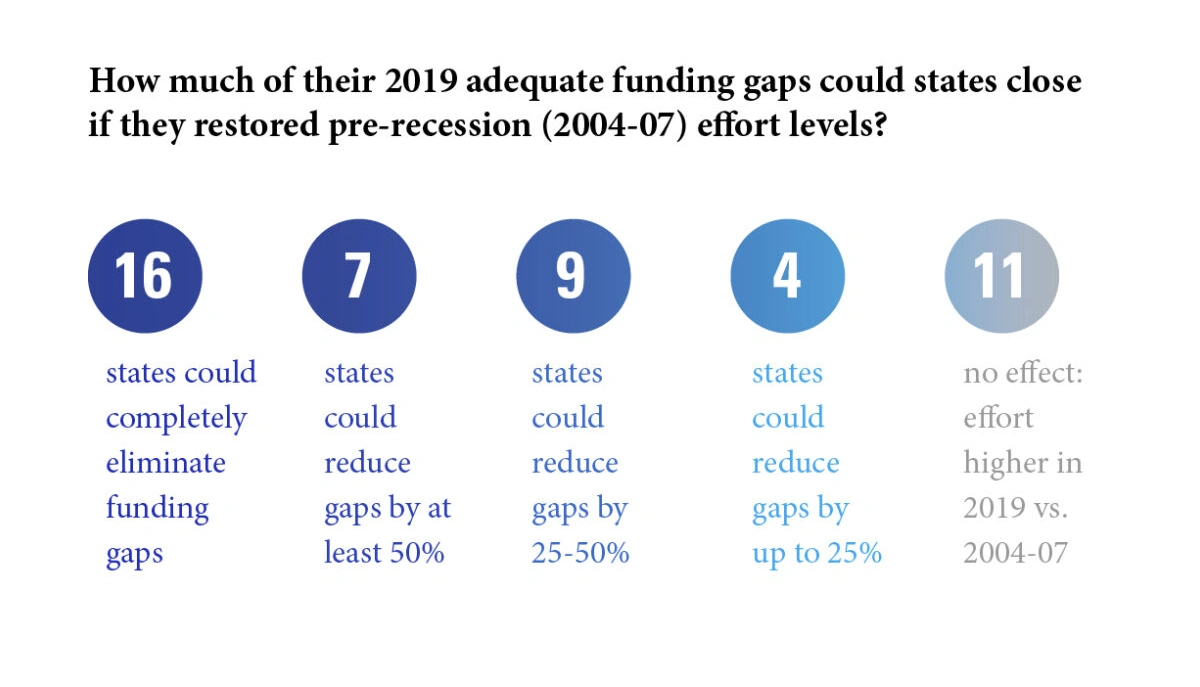
States could cut the total U.S. funding gap in half by returning to their effort levels from just 15 years ago.
Average 2004-2007 effort levels would produce enough additional funding to (hypothetically) eliminate 2019 negative funding gaps in 16 states (with money left over), and to reduce the funding gaps more than 50 percent in 7 other states.
Overall, these pre-recession effort levels could reduce the total U.S. negative funding gap by 51 percent.
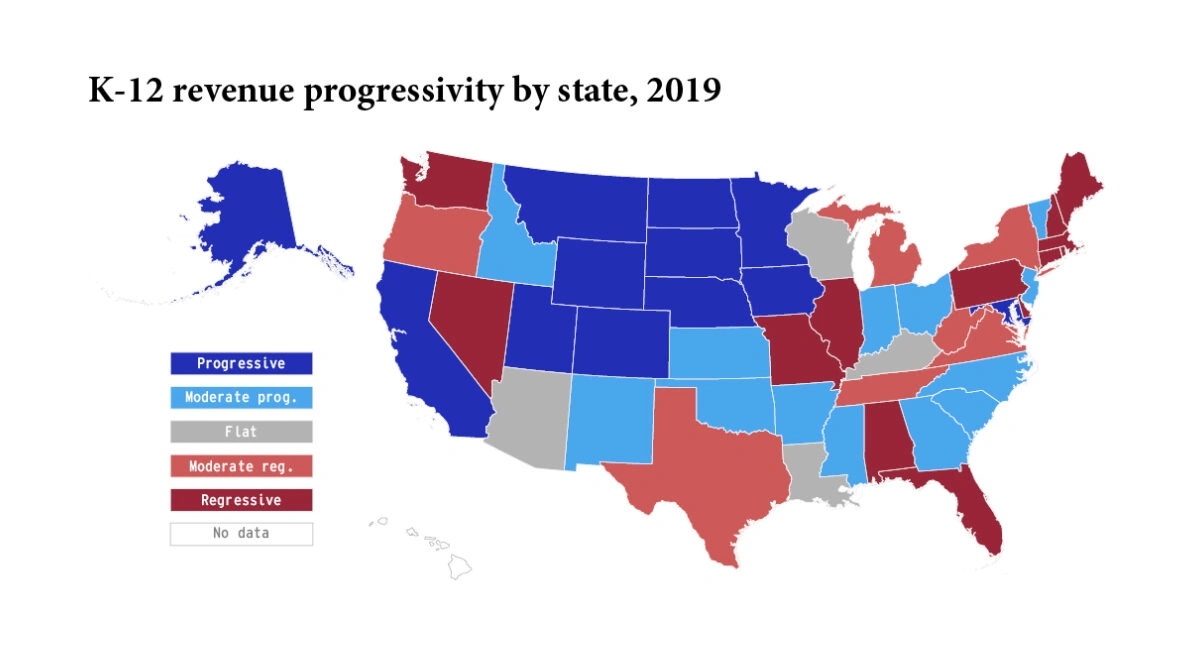
In most states, K-12 funding is either regressive or, at best, modestly progressive.
In 20 states, high-poverty districts receive less funding than do the lowest-poverty districts (i.e., funding is “regressive”).
In only 12 states do high-poverty districts receive at least 10 percent more than the lowest-poverty districts.
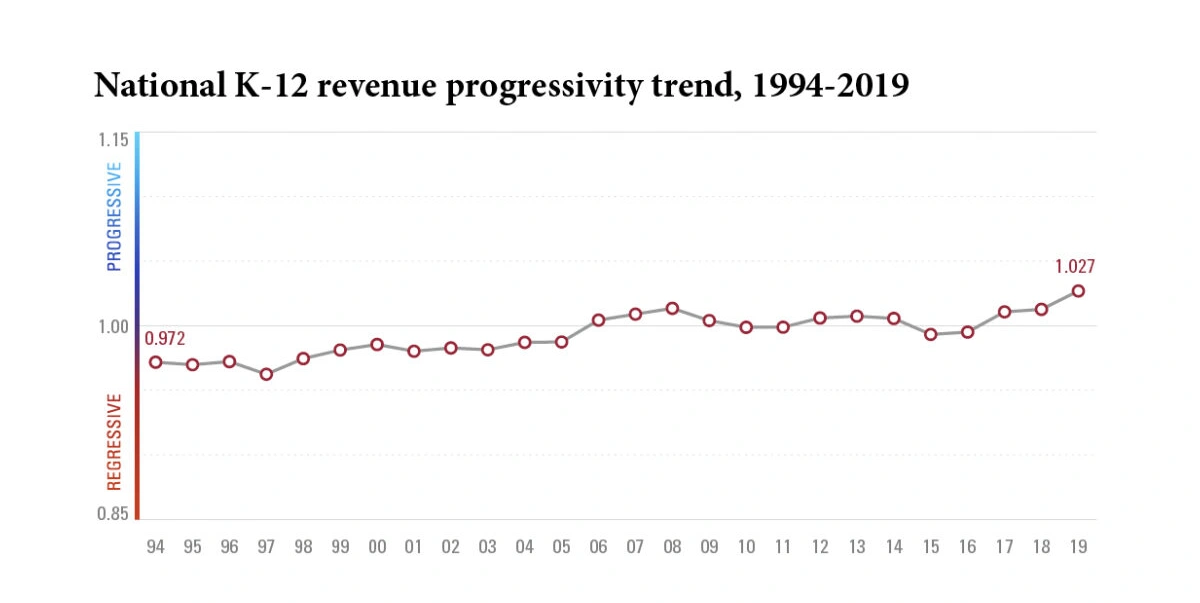
On average, U.S. school funding has been non-progressive for at least 25 years.
Since 1994, high- and low-poverty districts receive roughly the same amount of revenue—i.e., funding is neither progressive nor regressive.
But it has improved somewhat, going from nominally regressive throughout the 1990s and early 2000s to nominally progressive in 2019.
Section title
The primary conclusions from these findings are that the vast majority of states are failing to provide adequate and equitable funding for their students, and that this failure is due largely to policy choices. States, on average, are devoting smaller shares of their economies to schools than at any point in the past two decades, and the revenue they do raise is in many cases distributed inequitably. It is hardly surprising that only a handful of states fund their highest-poverty districts adequately.
Yet addressing this problem is not unfeasible. For instance, restoring pre-recession effort levels could make a large dent in states’ adequate funding gaps. This is not some utopian pipe dream—these levels were the reality just 15 years ago. In addition, federal funds should be targeted based not only on need but also at states in which effort is relatively high but low capacity constrains the ability to raise enough revenue to meet students’ needs.
Our findings also highlight the enormous heterogeneity of school funding, both within and between states. And, to reiterate, the situation is not uniformly bad. There are, in fact, a few states in which resources are generally adequate and distributed equitably, and there are relatively few that perform poorly on all three of our core measures. Such diversity is no accident. So long as school finance is primarily in the hands of states, the structure and performance of systems is likely to vary substantially between those states.
The upside of this diversity is that it has allowed researchers to study how different systems produce different outcomes and, as a result, we generally know what a good system looks like. It is our hope (and intention) that the data presented in this report will inform school finance debates in the U.S., and help to guide legislators toward improving their states’ systems.