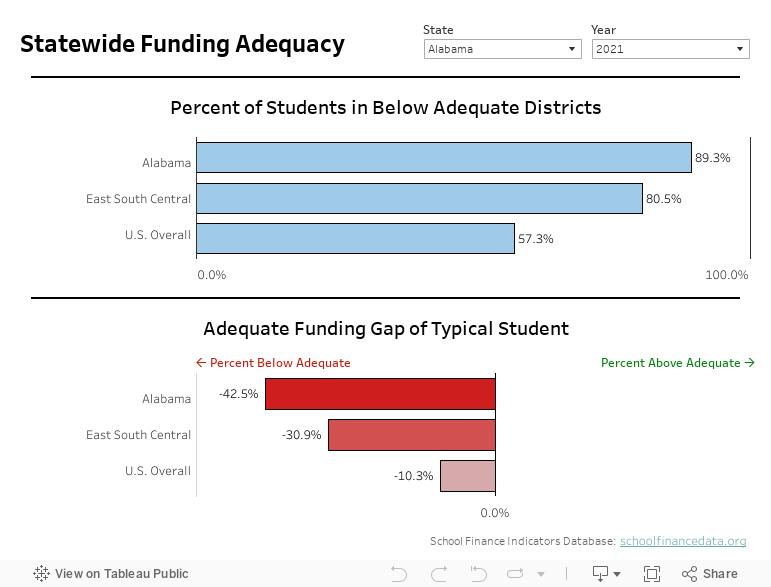
Visualization: Statewide funding adequacy
Select a state and year to display results on the adequacy of K-12 spending across entire states. Two graphs will appear, which represent two different ways of expressing statewide adequacy:
- Percent of students in below adequate districts: the percent of students attending schools in districts where spending is below estimated levels adequate to achieve national average testing outcomes;
- Adequate funding gap of the typical student: the percentage difference between actual and estimated adequate spending in the typical student’s district.
The best way to interpret these estimates is to compare them with those in other states (or groups of states) in the same year or in the same state over time. Accordingly, both graphs provide estimates for the selected state as well as comparisons with the selected state’s Census division (defined here) and the U.S. overall (you can view more of these comparisons, as well as trends for your state over time, in our one-page state finance profiles). Adequacy estimates are not available for Alaska and Hawaii, or for Vermont between 2017-2023 (due to data irregularities). For more information on these measures, see our State Indicators Database user’s guide and our annual report. You can also download the full dataset.
Note: if you get an “unexpected error” message when attempting to load the Tableau visualization, try enabling third party cookies in your web browser.
Latest News
 UPDATED ANNUAL REPORT, PROFILES, AND DATASETS AVAILABLE
February 2026: Read the eighth edition of our annual report, view your state’s one-page finance profile, use our data visualizations, or download the full state-level dataset.
Latest Annual Report
 The Adequacy and Fairness of State School Finance Systems (8th edition)
The eighth edition of our annual report presenting findings on effort, statewide adequacy, and equal opportunity in state school finance systems. Published February 2026.
Latest Research Briefs
 State School Finance System Profiles (2022-23 school year)
One-page profiles summarizing the key results on effort, statewide adequacy, and equal opportunity for all 50 states and D.C. View your state’s profile. Published February 2026.


Copyright © 2022-2023 Albert Shanker Institute | All Rights Reserved