Data visualization tools
The links below direct to different data visualizations, all of which present data from either our State Indicators Database or District Cost Database. The visualizations are all updated annually with the latest data, and they are divided into three categories:
- One-page state profiles: view one-page PDF summaries of each state’s system
- District visualization: display adequacy estimates for over 12,000 individual school districts
- State visualizations: display individual states’ estimates for a selection of measures
Additional information about each visualization can be found on its webpage. You can also download the full datasets in Excel or Stata format.
One-page state profiles
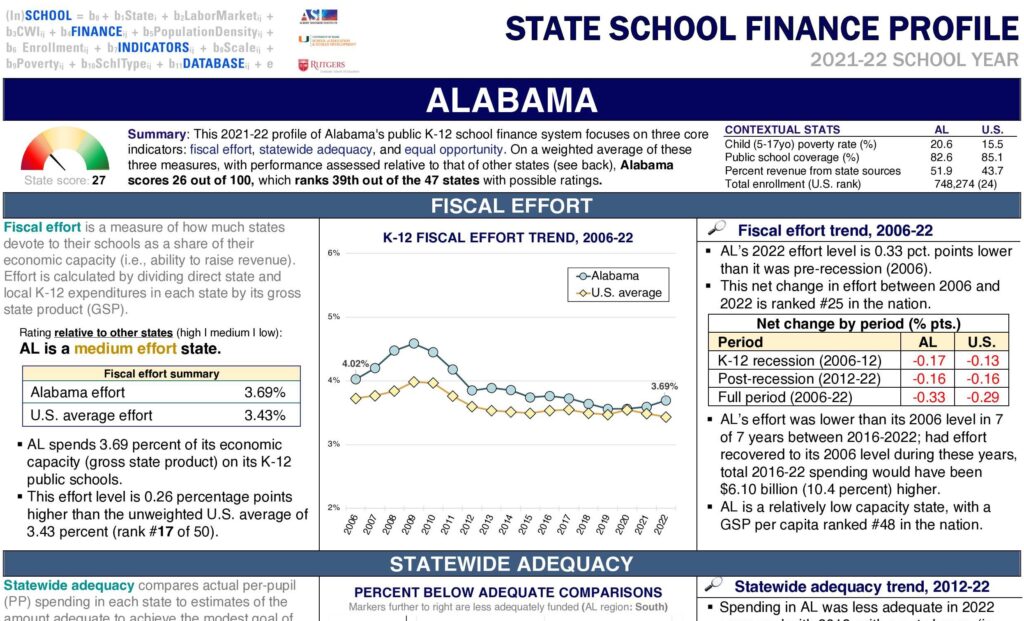
One-page state finance profiles
Single-page summaries of the effort, adequacy and fairness of each state’s school finance system.
SFID data source: State Indicators Database
District visualization
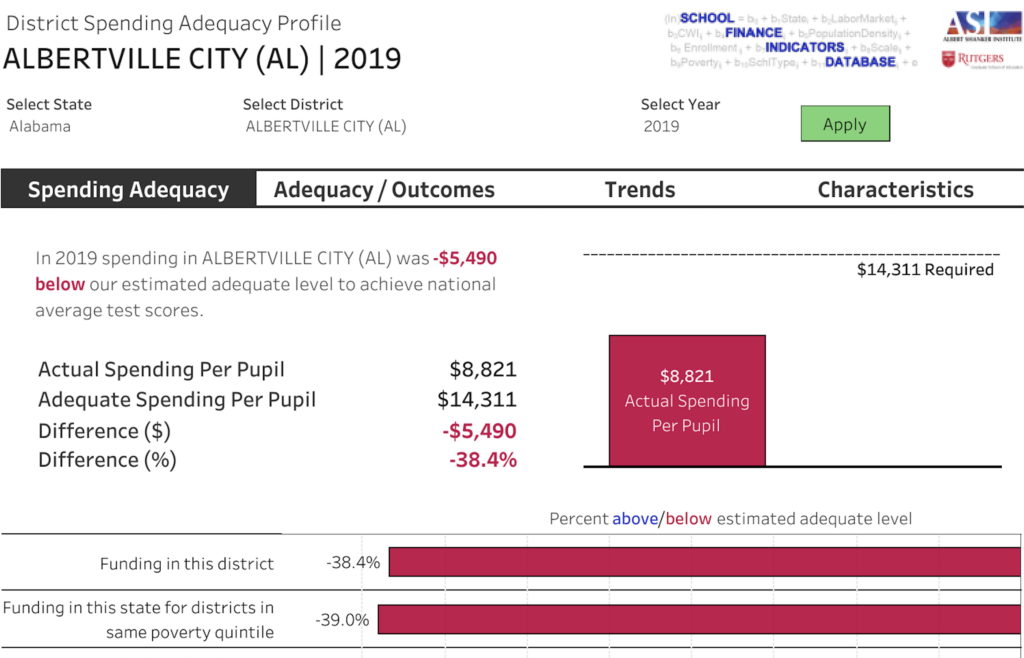
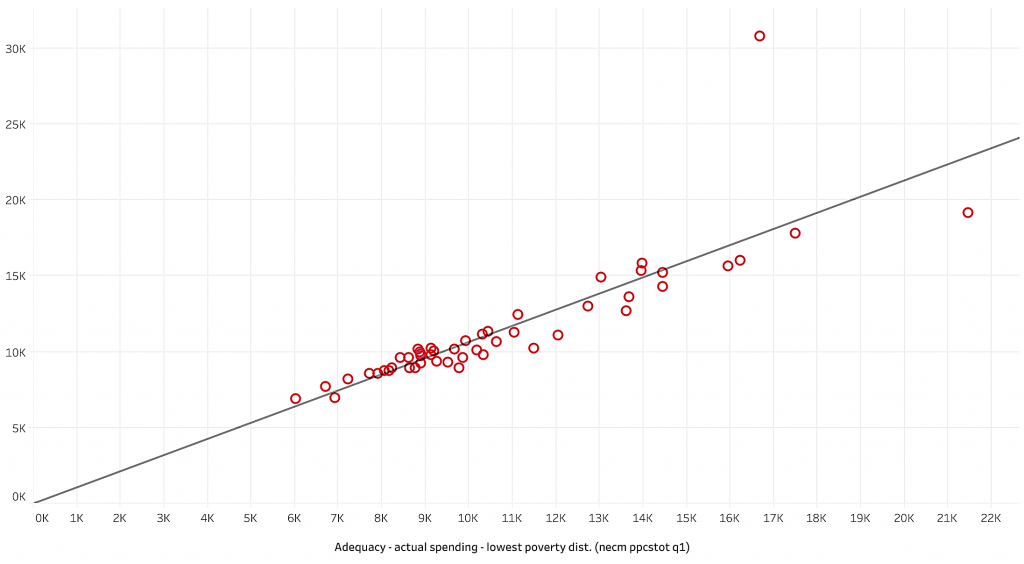
District spending adequacy profiles
Compare actual and estimated adequate spending levels for 12,000 U.S. public school districts between 2009-22.
SFID data source: District Cost Database
State visualizations
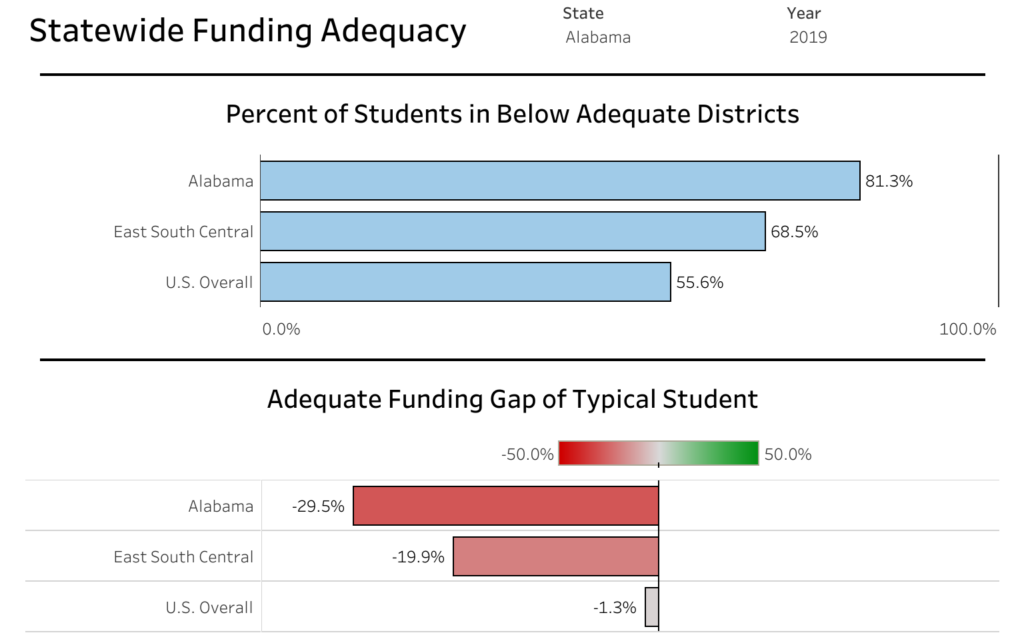
Statewide spending adequacy
The percentage of students in districts with below adequate funding and average adequacy gaps, by state and year (2009-2023).
SFID data source: State Indicators Database
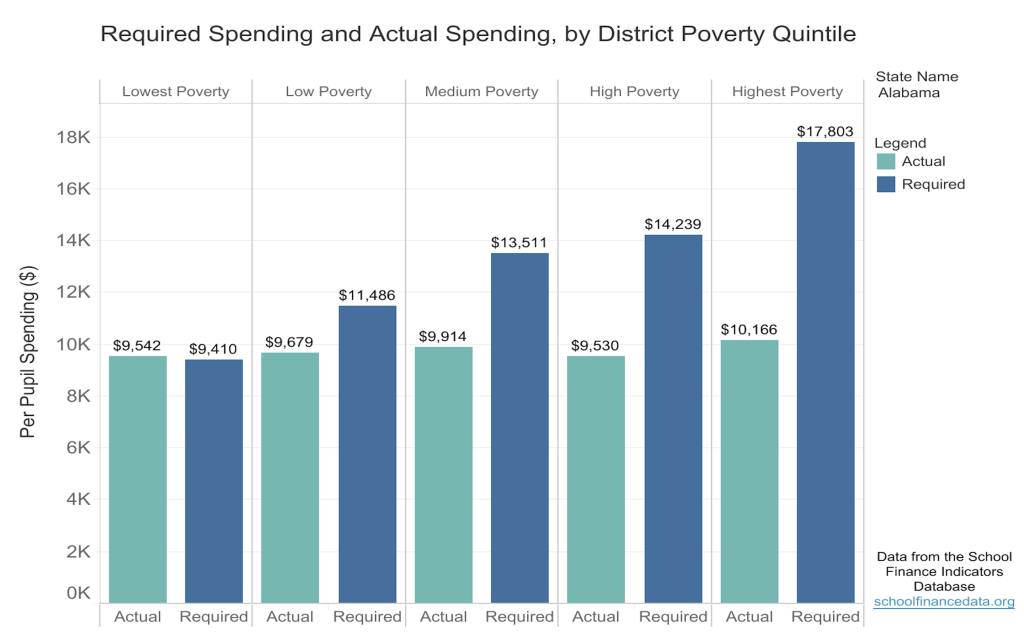
Equal opportunity (adequacy by district poverty)
K-12 spending adequacy by district poverty quintile and equal opportunity gaps (2009-2023).
SFID data source: State Indicators Database
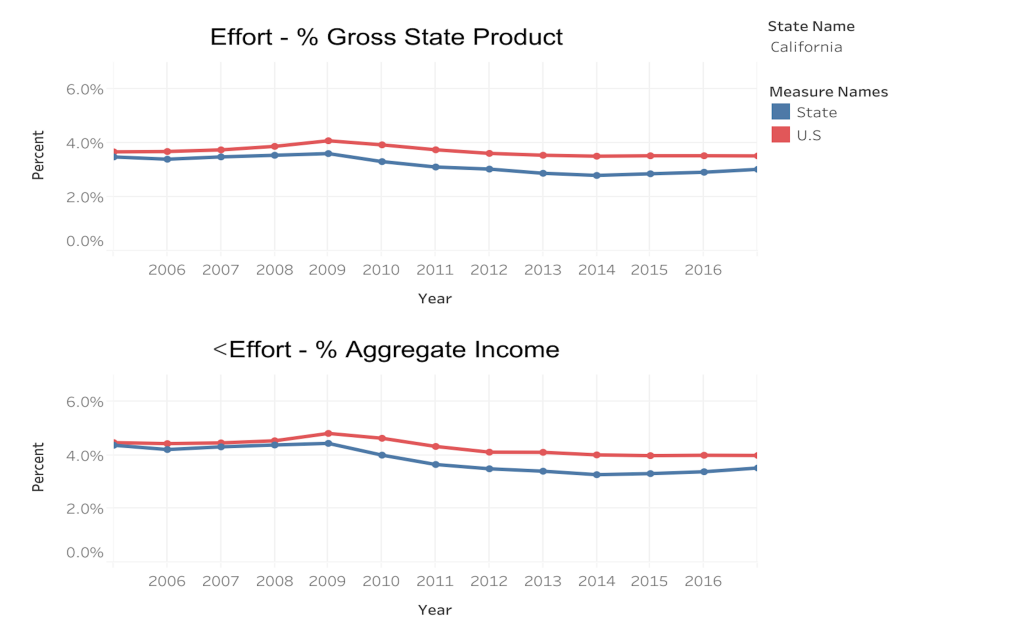
State fiscal effort
State and national trends in the proportion of states’ economies devoted to K-12 schools (2006-2023).
SFID data source: State Indicators Database
Relationships between state indicators
Create scatterplots comparing the relationships between your choice of two state indicators (2023 only).
SFID data source: State Indicators Database
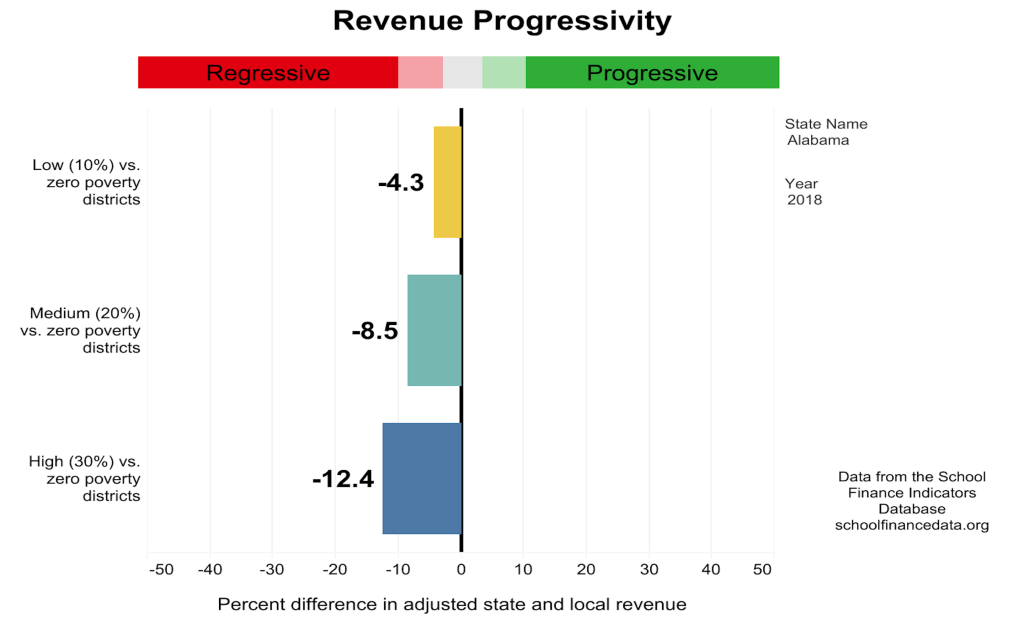
State funding progressivity
Differences in adjusted state and local K-12 revenue between high and zero poverty districts (1993-2023).
SFID data source: State Indicators Database
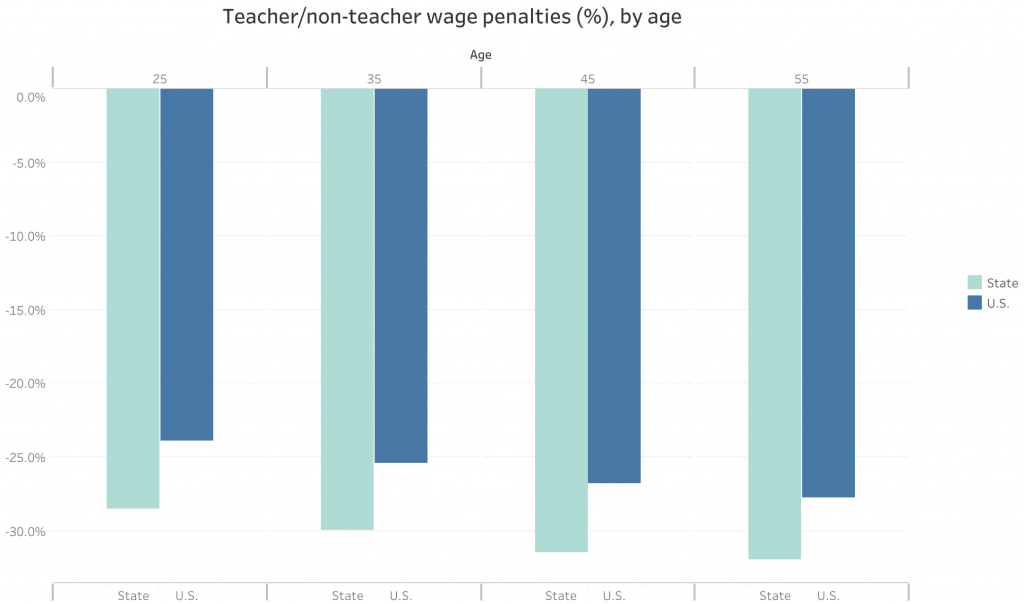
State teacher wage penalties
Teacher/non-teacher wage gaps for each state and nationally, by teacher age (2000-2023).
SFID data source: State Indicators Database
Visualizations designed by Bilan Jama, Emilee O’Brien, and Lauren Schneider
Latest News
 UPDATED ANNUAL REPORT, PROFILES, AND DATASETS AVAILABLE
February 2026: Read the eighth edition of our annual report, view your state’s one-page finance profile, use our data visualizations, or download the full state-level dataset.
Latest Annual Report
 The Adequacy and Fairness of State School Finance Systems (8th edition)
The eighth edition of our annual report presenting findings on effort, statewide adequacy, and equal opportunity in state school finance systems. Published February 2026.
Latest Research Briefs
 State School Finance System Profiles (2022-23 school year)
One-page profiles summarizing the key results on effort, statewide adequacy, and equal opportunity for all 50 states and D.C. View your state’s profile. Published February 2026.


Copyright © 2022-2023 Albert Shanker Institute | All Rights Reserved